Note: This Report is a Complex Valuation Analysis. This Report is only For People Who Are Aware of
Advance Finance And Mathematics.
Overview
Tesla’s market capitalization (~$1.1 trillion) is extremely high relative to its fundamentals. In 2024 Tesla
reported ~$97.7 billion in revenue (just +1% YoY) and ~$7.1 billion in GAAP net income. Its operating
margin (~7–8%) and ROE (≈8–10%) are modest. However, Tesla trades at very rich multiples: its
trailing P/E is ~209× (forward P/E still well over 100×) and P/B ~12–13×
, far above industry norms. By
comparison, Toyota’s P/E is ~9× (with ROE ≈12% ), Ford ~14×
, and GM ~12×
. Even EV peers are far
lower: BYD’s P/E ~41×
, while loss-making Rivian and Lucid have no P/E (and high debt). Tesla’s
EBITDA margin (non-GAAP) was ~17% in 2024, which is respectable but not stratospheric (Toyota,
Ford and GM also earn double-digit gross margins after credits). Importantly, Tesla ended 2024 with
very strong liquidity (~$36.6 billion cash and only ~$7.9 billion debt ), making it essentially a net-cash
company.
Financial Ratios and Fundamentals
Tesla’s price-to-earnings is by far the highest in its sector – roughly an order of magnitude above
legacy automakers. For example, Toyota (P/E ≈9× ), Ford (≈14×) and GM (≈12×) all trade at singledigit or low double-digit P/Es, while Tesla exceeds 200×
. Price-to-book follows the same pattern
(Tesla’s P/B ~13× vs.
~1× for Toyota and GM). Tesla’s PEG (P/E-to-growth) is also high given that its
revenue growth has slowed to low single digits: analysts project ~2% organic revenue growth in 2025
after roughly flat 2024, implying a PEG well above 1. Profitability metrics are solid but not exceptional:
Tesla’s adjusted EBITDA margin (~17%) and GAAP operating margin (~7.2% in 2024) exceed legacy
automakers’ current margins but are down from Tesla’s prior highs (profit margin fell from ~13% in
2023 to ~7% in 2024). Return on equity (GAAP ROE) is only ~8% , lower than Toyota’s ~12%. In
summary, Tesla’s valuation multiples are far richer than its fundamental performance and
growth rates. ...
Peer Benchmarking
Benchmarks highlight Tesla’s premium. Its P/E (~209×) dwarfs traditional carmakers (e.g. Toyota ~9× ;
Ford ~14×; GM ~12× ) and even high-growth tech (e.g. Amazon ~36× ). A recent Reuters analysis noted
Tesla “trades at more than 100 times estimated earnings” for the next 12 months – over 20× GM’s
multiple. On P/S, Tesla’s ≈10× far exceeds most peers (Ford/GM each < 1×). Among EV specialists,
BYD’s P/E (~41× ) is the nearest comparable, but Tesla’s is still ~5× higher. Loss-making EV startups
Rivian and Lucid show the risk in lofty valuations – both have negative earnings and steep debts (e.g.
Rivian Debt/Equity ~0.8 ). In short, every conventional valuation metric (P/E, P/B, EV/EBITDA, etc.)
places Tesla at a massive premium to peers.
Stock Price vs. Fundamentals
Tesla’s share price has swung far more than its fundamentals. For example, TSLA rose from ~$90 at
end-2019 to peaks near $400 in 2021 (split-adjusted), only to fall back to ~$90 in late 2022 and ~$108
in 2023. As of Sept 2025 it trades around ~$345 . Meanwhile its revenue grew from $53.8B in 2021 to
~$97.7B in 2024 – about doubling over three years, far slower than the multiples implied by its stock
performance. Its free cash flow was $3.6B in 2024 (up only slightly), meaning Tesla’s massive market
cap (~$1.08T ) represents ~$287 of market value for each $1 of FCF. These divergences suggest that
much of Tesla’s share price reflects future expectations and optionality rather than current profits.
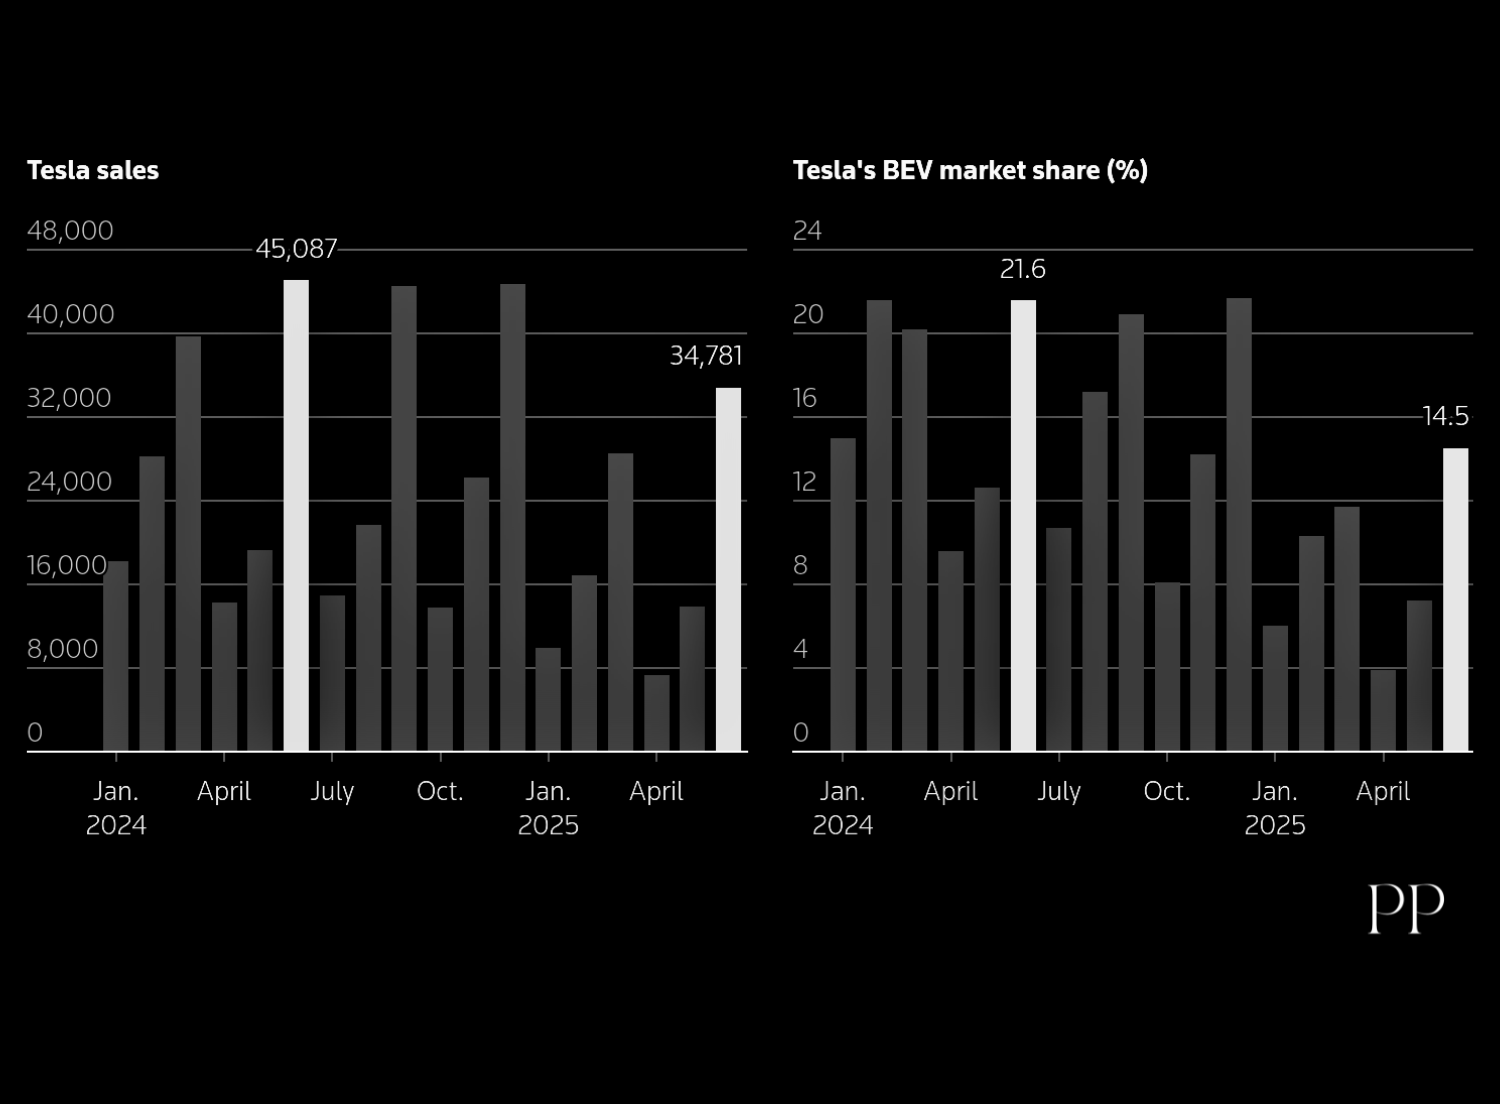
Figure: Tesla’s quarterly BEV sales (green bars) and market share (brown bars) in Europe, 2024–2025 (Reuters). Tesla’s market
share in Europe fell sharply from ~21.6% in mid-2024 to ~14.5% by mid-2025, reflecting rising competition and delivery setbacks.
Analyst Opinions & Targets
Wall Street is wary. As of Sep 2025, the consensus rating on TSLA is a Hold, with 41 analyst opinions
comprising 18 Buys, 14 Holds, 9 Sells and 1 Strong Buy . The average 12-month price target (~$303)
implies a ~13% downside from the ~$347 price. TipRanks similarly shows a consensus around $306.
Targets span a huge range ($19 to $500 ), reflecting disagreement about Tesla’s prospects. For
example, Wedbush (Aug 2025) reiterated a “buy” with a $500 target , while Guggenheim advised
“sell” with a $175 target . MarketBeat notes analysts as a group see downside, and one quant site
(AlphaSpread) even estimates Tesla’s “intrinsic” value near ~$47, suggesting TSLA is 87% overvalued.
On balance, analysts express caution: in 2025 the stock fell ~20% YTD amid weak sales, yet some see
2026 potential as new models and autonomy unfold.
Short-Term (1–6 months)
In the near term, TSLA’s trend has been sideways-to-down. After rallying early 2025, the stock drifted
down (~17% since Jan 2025 ). Ongoing concerns – weaker-than-expected deliveries, price cuts, and
volatility from CEO Musk’s other ventures – weigh on sentiment. Technical indicators are mixed: some
short-term charts turn bullish, but overall momentum is tepid. Analysts’ 1- month outlook
(TradingView) is modestly optimistic, but near-term catalysts (e.g. Q3 results, Cybertruck launch) will
drive action. Risks: near-term macro headwinds (high rates), and any shock from U.S./China or
regulatory news could trigger volatility.
Mid-Term (1–3 years)
Over the next few years, fundamentals should matter more. Tesla’s growth has slowed: 2024
deliveries (~1.8M) barely topped 2023, while EV competitors (BYD, Volkswagen, GM, etc.) are rapidly
expanding. Reuters notes Tesla’s market share is eroding globally. If Tesla cannot sustain robust
growth, its lofty multiples look increasingly unjustified. On the other hand, Tesla is investing heavily in
cost reduction, new factories (Texas, Berlin full output, potential India entry) and new products
(scaled-up Cybertruck, lower-cost models). Analysts have cut forward EPS forecasts ~55% over the past
year, reflecting these headwinds. In a neutral scenario, Tesla may grow at mid-single-digit rates,
implying a lower fair multiple (e.g. 10–20× forward earnings, akin to peers). Under that view, TSLA
would trade far below current levels. Conversely, if Tesla rapidly executes on autonomous driving,
energy and robotaxi optionalities, it could justify higher valuation – but these remain uncertain.
Long-Term (5+ years)
Bulls argue Tesla is more than an automaker, citing AI/autonomy and energy businesses. Tesla’s led
the EV transition, holds huge data on driving/charging, and may capture premium niches (robotaxis,
energy storage, insurance, AI). Over 5+ years, if Tesla successfully scales these “optionality”
businesses, earnings could eventually justify a higher market value. Some forecasts (CoinCodex,
Benzinga) even model TSLA reaching $800–$2500 by 2040–50 under best-case assumptions. However,
these scenarios assume flawless execution and regulatory approvals. If Tesla merely competes as
an auto/energy company (like a very large GM/Toyota equivalent), its valuation likely would revert to
industry norms (e.g. 10–15× earnings). The Breakingviews team cautions that Tesla may transition
from “OMG” (unicorn) to “GM” (just another carmaker) without its former growth.
Conclusion
By most metrics, Tesla’s stock price appears extremely high relative to its current fundamentals and
realistic near-term outlook. Its P/E, P/S and P/B ratios far exceed those of comparable automakers,
and analysts consensus targets imply downside. Only very optimistic long-term scenarios – hinging on
unproven technologies and market dominance – justify current levels. Thus, based on 2025 data and
consensus estimates, Tesla is best viewed as significantly overvalued today, and investors should
exercise caution.
Sources: SEC filings and corporate reports ; Reuters, Bloomberg, MarketBeat, Capital.com and other financial analysis. Source of
Chart Above Goes to ACEA And Reuters. (figures and forecasts as cited above).